Warming does not only melt ice slowly. It also makes it burst.
Gyirong port on the China–Nepal border, 26 August 2026, 10:59, seen by the crossing's own camera. Seven minutes earlier, ice broke off a glacier at about 5,200 m in the mountains above, in Nepal. Falling, it scraped up rock and moraine and became a debris flow that ran some 20 km down the Lhende valley, flattened the port, and went on nearly 100 km into Nepal. · 2026 年 8 月 26 日 10:59,中尼边境吉隆口岸,口岸自己的监控镜头。七分钟前,尼泊尔境内海拔约 5200 米的冰川发生冰崩;冰体高位坠落,沿沟铲刮岩石与冰碛,演变为高速泥石流,沿东林藏布河谷奔流约 20 公里,将口岸夷为平地,再向下游冲入尼泊尔近 100 公里。
Footage: Gyirong port surveillance camera (吉隆口岸热索桥), as circulated online. Not covered by this project's CC-BY licence. · 画面:吉隆口岸热索桥监控镜头,网络流传版本。不在本项目 CC-BY 许可范围内。
A glacier can fail in more ways than one. A lake dammed by its own moraine can burst. The glacier body can slide off a slope long thought too gentle to fail. And where ice has withdrawn from a fjord wall, the rock it once held up can fall into the water and send a wave hundreds of metres up the opposite shore. The three are studied by different communities and catalogued in different databases. This map puts them together: every recorded event since 1179, and the sites that institutions are watching now. · 冰川不止一种失稳方式。冰碛坝拦蓄的冰湖可能溃决;冰川本体可能从一度被认为过于平缓的坡面上滑脱;而在冰体退出峡湾之后,失去支撑的岩壁可能坍入水中,激起沿对岸爬升数百米的巨浪。三者分属不同的研究群体、记录在不同的数据库里。这张地图把它们放在一起:自 1179 年以来每一次有记录的事件,以及此刻有机构在监测的地点。
Three ways a glacier fails. Read them once and the marks on the globe make sense. · 冰川失稳的三种方式。读过一遍,图上的标记便一目了然。
Mechanism 1 of 3
Glacier detachment
The glacier body itself, or the rock wall above it, comes down as an ice or rock-ice avalanche. · 冰川本体或其上方的岩壁整体崩落,形成冰崩或冰岩混合崩塌。
Trigger, examples, state of the science
- Physical trigger
- Meltwater and warming at the glacier bed reduce friction until a large part of the glacier accelerates and detaches. Kääb et al. report detachments on slopes of roughly 10–20° — far below the 30–45° of ordinary avalanche terrain. · 融水与升温降低冰川底部的摩擦,直至大部分冰体加速并整体滑脱。Kääb 等人报告的滑脱发生在约 10–20° 的坡面上——远低于普通雪崩地形的 30–45°。
- Named examples
- Aru Range, Tibet, 2016: two glaciers collapsed within two months, the first killing nine herders. Blatten, Switzerland, 2025: the Birch Glacier, loaded by rockfall, buried most of a village. · 2016 年西藏阿汝错:两个月内两条冰川相继崩塌,第一次夺去九名牧民的生命。2025 年瑞士 Blatten:Birch 冰川在岩崩加载下崩落,掩埋了村庄的大部分。
- State of the science
- Not thought physically possible on low-angle glaciers until recently; the first global inventory is a 2026 preprint still in open review. · 低坡度冰川的整体滑脱直到最近才被认为在物理上可能;首个全球编目是一份仍在公开评审中的 2026 年预印本。
Mechanism 2 of 3
Glacial lake outburst flood
A dam of moraine, ice or landslide debris holding back a glacial lake fails, releasing the lake in hours. · 拦蓄冰湖的冰碛坝、冰坝或滑坡坝失稳,湖水在数小时内倾泻而下。
Trigger, examples, state of the science
- Physical trigger
- Lakes grow as glaciers retreat; the dam is overtopped by a displacement wave from ice or rockfall, erodes, or fails by piping. · 冰川退缩使冰湖扩张;坝体或被冰崩、岩崩激起的涌浪漫顶,或被侵蚀,或因管涌而溃。
- Named examples
- Lake Palcacocha, Peru, 1941: the flood destroyed part of Huaraz and killed thousands. South Lhonak, Sikkim, 2023: a moraine collapse destroyed a hydropower dam downstream. · 1941 年秘鲁帕尔卡科查湖:洪水摧毁瓦拉斯部分城区,数千人遇难。2023 年锡金南 Lhonak 湖:冰碛坍塌摧毁了下游的水电站大坝。
- State of the science
- The mature field of the three: global inventories, ranked danger lists, and engineered remedies — siphons, spillways, lowered lake levels — exist. · 三者中最成熟的领域:已有全球编目、危险性排序清单和工程处置——虹吸、溢洪道、人工降低湖面。
Mechanism 3 of 3
Displacement wave
A fjord or lake wall left unsupported by retreating ice fails into the water, displacing a wave that can run hundreds of metres up the opposite slope. · 冰川退缩后失去支撑的峡湾或湖岸岩壁坍入水中,激起的涌浪可沿对岸爬升数百米。
Trigger, examples, state of the science
- Physical trigger
- Glacial debuttressing: the ice that pressed against the slope for millennia thins and withdraws, and the slope relaxes, cracks, and eventually fails — sometimes decades later. · 冰川卸载效应:数千年来抵住山坡的冰体变薄退去,坡体松弛、开裂,最终坍塌——有时滞后数十年。
- Named examples
- Taan Fiord, Alaska, 2015: runup to 193 m. Dickson Fjord, Greenland, 2023: a wave that set the whole fjord ringing for nine days, recorded by seismometers worldwide. · 2015 年阿拉斯加塔安峡湾:浪高爬升至 193 米。2023 年格陵兰迪克森峡湾:一场巨浪令整条峡湾震荡九天,全球地震仪都记录到了它。
- State of the science
- The thinnest layer of the three: the only global catalogue stops in 2012, before every event that made the hazard class visible. This map's wave layer is hand-compiled from per-event studies. · 三层数据中最薄的一层:唯一的全球目录止于 2012 年,恰在让这一灾害类型广为人知的历次事件之前。本图的涌浪层由逐事件研究人工汇编。
Reading the map
- occurred
- An event in the databases, at the place and in the year they record. · 数据库中记录的一次事件,按其记录的地点与年份。
- watched
- A site an institution is formally watching or has assessed. The list is not ranked. · 有机构正式观测或评估过的地点。列表不作排序。
- reach
- The documented reach from a watched site, along the valley or fjord its sources name; the arrows point downstream. · 观察点记载的影响路径,沿其来源所述的山谷或峡湾;箭头指向下游。
- distance only
- A distance the sources give without a route; no path is drawn. · 来源只给出距离而无路线;不画路径,只画虚线圆。
The map of known hazard is substantially a map of observation. Reported events concentrate where people and instruments are: Bashkova et al. state this directly of their inventory, and Veh et al. found documented GLOFs increased six-fold over the 20th century, with most reports from northwest North America and Iceland. Blank regions on this map are unobserved, not safe. · 已知灾害的地图,在很大程度上是观测活动的地图。事件记录集中在有人、有仪器的地方:Bashkova 等人对其编目直言此点;Veh 等人发现 20 世纪有记录的冰湖溃决增长了六倍,而报告多来自北美西北部和冰岛。图上的空白是未被观测,不是安全。
The globe
The map of known hazard is substantially a map of observation.
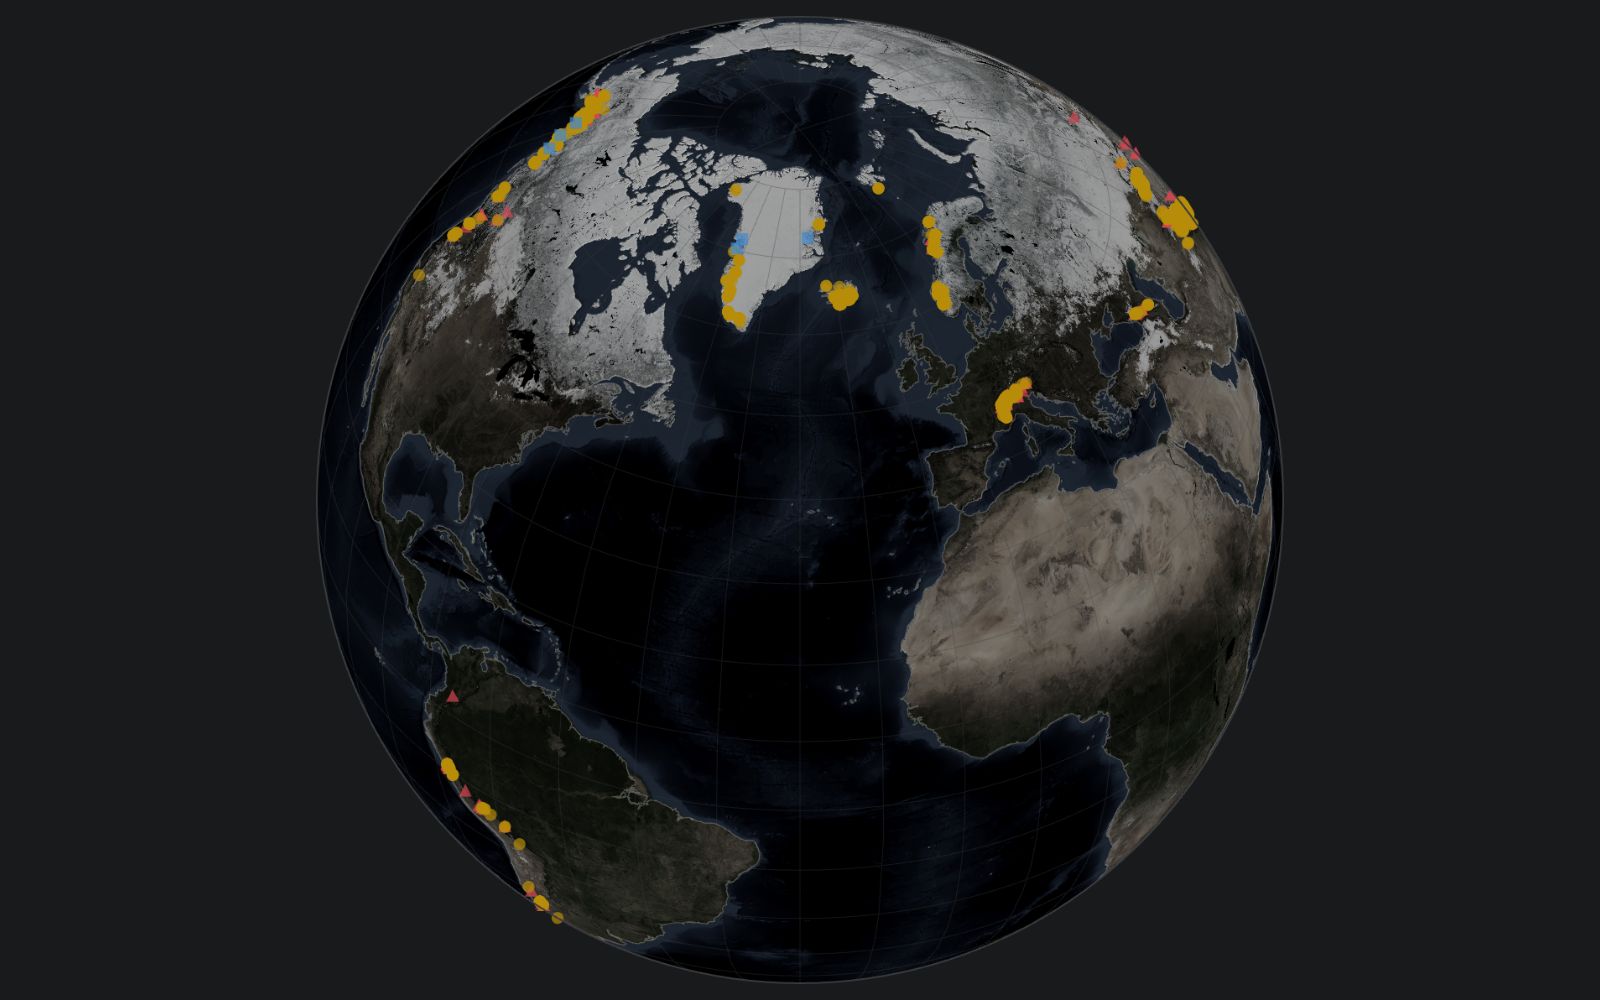
Drag to rotate · scroll or pinch to zoom · click a marker for detail
Watched sites
Hollow markers on the globe. An institution is watching each one; the list is not ranked. Tap a site to fly to it. · 即地球上的空心标记。每一处都有机构在监测;本列表不排序。点按可飞往该地点。
-
Åknes (Åkerneset) 奥克内斯不稳定岩坡 Displacement wave · 冰崩海啸
Storfjorden, Stranda, Norway · 挪威斯特兰达市斯图尔峡湾
Norway's most closely watched rock slope: NVE's 2026 revision maps 31 × 10⁶ m³ of unstable rock across failure scenarios with an aggregate annual probability near 1/60. Larger scenarios would send fjord-crossing waves into populated shores including Hellesylt and Geiranger — the most complete monitoring-and-evacuation governance model that exists.
挪威监测最严密的岩坡:NVE 2026 年修订评估划定 3100 万立方米不稳定岩体,各失稳情景合计年概率约 1/60。较大情景的涌浪将波及 Hellesylt、Geiranger 等有人居住的峡湾沿岸——现有最完整的监测与撤离治理范本。
·
NVE failure scenarios send fjord-crossing waves as far as Hellesylt and Geiranger (NVE 2026); the two villages lie about 16 and 27 km from the slope along the fjords. · NVE 失稳情景中,涌浪沿峡湾波及 Hellesylt 与 Geiranger(NVE 2026);两村沿峡湾距坡体约 16 与 27 公里。
About 16 km along Sunnylvsfjorden, to Hellesylt · 沿松尼尔夫峡湾约 16 公里,至海勒叙尔特
About 27 km along Geirangerfjorden, to Geiranger · 沿盖朗厄尔峡湾约 27 公里,至盖朗厄尔
Small flank, scenario D · 小侧翼失稳(情景 D): 2.4 × 10⁶ m³ (Norges vassdrags- og energidirektorat (NVE). Åknes — kontinuerlig overvåket fjel… · Kristensen, L., Indrevær, K., Pless, G., Hermanns, R., & Nicolet, P. S. (2026). …)
Large flank, scenario C · 大侧翼失稳(情景 C): 7.4 × 10⁶ m³ (Norges vassdrags- og energidirektorat (NVE). Åknes — kontinuerlig overvåket fjel… · Kristensen, L., Indrevær, K., Pless, G., Hermanns, R., & Nicolet, P. S. (2026). …)
Central block, scenario B · 中部块体失稳(情景 B): 9.7 × 10⁶ m³ (Norges vassdrags- og energidirektorat (NVE). Åknes — kontinuerlig overvåket fjel… · Kristensen, L., Indrevær, K., Pless, G., Hermanns, R., & Nicolet, P. S. (2026). …)
Whole slope, scenario A · 整体失稳(情景 A): 31 × 10⁶ m³ (Norges vassdrags- og energidirektorat (NVE). Åknes — kontinuerlig overvåket fjel… · Kristensen, L., Indrevær, K., Pless, G., Hermanns, R., & Nicolet, P. S. (2026). …)
-
Amney Machen 阿尼玛卿雪山 Glacier detachment · 冰岩崩塌
Maqên County, Golog, Qinghai, China · 中国青海省果洛州玛沁县
One of the rare sites with confirmed recurrence: at least four glacier collapses between 2004 and 2019 — the 2004 event alone 20–25 × 10⁶ m³ — tied to surge cycles loaded by a developing rock-slope instability.
少数经确认反复发生冰川崩塌的地点之一:2004–2019 年至少四次——仅 2004 年一次即达 2000–2500 万立方米——与跃动周期及发育中的岩坡失稳相关。
·
Documented ice–rock avalanche runouts of about 5 km onto grazing land in the 2004–2019 events; Kääb et al. (2021) give the site a reach of 5.2 km over a 1 km drop. · 2004–2019 年历次冰岩崩塌堆积体延伸约 5 公里,覆盖牧场;Kääb 等(2021)给出该处影响长度 5.2 公里、落差 1 公里。
About 5.2 km down-slope · 沿坡向下约 5.2 公里
2004 collapse · 2004 年冰川崩塌: 25 × 10⁶ m³ (Kääb, A., Jacquemart, M., Gilbert, A., Leinss, S., Girod, L., Huggel, C., Falasc… · Paul, F. (2019). Repeat Glacier Collapses and Surges in the Amney Machen Mountai…)
-
Barry Arm 巴里湾不稳定坡体 Displacement wave · 冰崩海啸
Prince William Sound, Alaska, United States · 美国阿拉斯加威廉王子湾
A slope of roughly 500 × 10⁶ m³, destabilised by the retreat of Barry Glacier, moved about 120 m between 2010 and 2017; early modelling suggested wave runup up to 300 m near the slide, and a 2021 USGS reassessment revised the worst case sharply downward. The best-instrumented site of its kind.
巴里冰川退缩使一处约 5 亿立方米的坡体失稳,2010–2017 年间位移约 120 米;早期模拟显示滑坡附近浪高爬升可达 300 米,2021 年 USGS 重新评估后大幅下调了最坏情形。同类坡体中监测手段最完备的一处。
·
Modelled tsunami scenarios reach Whittier across Prince William Sound (Dai et al. 2020; USGS 2021 reassessment), about 50 km from the slide in a straight line and 63 km by water. · 模拟海啸情景横跨威廉王子湾波及惠蒂尔(Dai 等 2020;USGS 2021 年重估);该镇距坡体直线约 50 公里,沿水路约 63 公里。
About 63 km along Port Wells, to Whittier · 沿波特威尔斯湾约 63 公里,至惠蒂尔
Smaller USGS volume · USGS 较小体积情景: 290 × 10⁶ m³ (Barnhart, K. R., Jones, R. P., George, D. L., Coe, J. A., & Staley, D. M. (2021)…)
Whole-slope collapse (2020) · 整体坡体崩塌(2020): 455 × 10⁶ m³ · runup 300 m (Dai, C., Higman, B., Lynett, P. J., Jacquemart, M., Howat, I. M., Liljedahl, A. …)
Largest plausible volume (2021) · 最大可信体积(2021): 689 × 10⁶ m³ · runup 500 m (Barnhart, K. R., Jones, R. P., George, D. L., Coe, J. A., & Staley, D. M. (2021)…)
-
Grímsvötn 格里姆斯沃特冰下湖 Glacial lake outburst flood · 冰湖溃决
Vatnajökull ice cap, Iceland · 冰岛瓦特纳冰原
The counter-example: near-annual subglacial outburst floods that are forecast and managed. Routine jökulhlaups peak near 1,000 m³/s; the extreme 1996 flood reached 45,000–50,000 m³/s. Thirteen floods since 2004 have passed without disaster.
反例:近乎每年发生、却被成功预报和管理的冰下湖溃决洪水。常规冰川洪水峰值约每秒 1000 立方米;1996 年的极端洪水达每秒 4.5–5 万立方米。2004 年以来的 13 次洪水均未成灾。
·
Jökulhlaups run about 50 km beneath Skeiðarárjökull (Björnsson 2010), then 20–25 km across Skeiðarársandur to the sea (Sigurðsson et al. 2000); since 2009 the water has taken the Gígjukvísl rather than the Skeiðará (IMO); the drawn lines measure about 86 km down the Gígjukvísl to the sea and about 56 km down the Skeiðará to the Route 1 crossing. · 冰川洪水先在斯凯扎冰舌下方奔流约 50 公里(Björnsson 2010),再横穿 Skeiðarársandur 冰水平原 20–25 公里入海(Sigurðsson 等 2000);2009 年起水流改走 Gígjukvísl 而非 Skeiðará(冰岛气象局);图上两条线沿 Gígjukvísl 量得约 86 公里入海,沿 Skeiðará 量得约 56 公里至 1 号环岛公路跨河处。
Along the Gígjukvísl, about 86 km · 沿吉丘克维斯尔河约 86 公里
Along the Skeiðará, about 56 km · 沿斯凯扎河约 56 公里
2010 jökulhlaup · 2010 年冰川洪水: 2,600 m³/s (Þorsteinsson, Þ. (2010). Jökulhlaup from Grímsvötn subsides. Icelandic Meteorolo…)
Typical 20th-century jökulhlaup · 20 世纪典型冰川洪水: 10,000 m³/s (Magnússon, E., Drouin, V., Pálsson, F., Hannesdóttir, K., Belart, J. M. C., Sigu…)
November 1996 jökulhlaup · 1996 年 11 月冰川洪水: 50,000 m³/s (Magnússon, E., Drouin, V., Pálsson, F., Hannesdóttir, K., Belart, J. M. C., Sigu… · Sigurðsson, O., Jónsson, P., Snorrason, Á., Víkingsson, S., Kaldal, I., & Pálsso…)
-
Kyirong–Lhende / Trishuli corridor 吉隆—热索瓦走廊 Glacier detachment · 冰岩崩塌 Glacial lake outburst flood · 冰湖溃决
Gyirong County, Tibet, China – Rasuwa District, Nepal · 中国西藏吉隆县—尼泊尔拉苏瓦县
A recurrent transboundary corridor, not a single site: a supraglacial-lake outburst from the Tibet side in July 2025, then, on 26 August 2026, an ice collapse from about 5,200 m above the Lhende valley in Nepal that became a debris flow, reached the Gyirong border post 20 km below in seven minutes, and ran on nearly 100 km into Nepal. Allen et al. (2019) rank six lakes in Gyirong county among the Tibetan Plateau's thirty most dangerous, all with exposure downstream in Nepal.
反复成灾的跨境走廊,而非单一点位:2025 年 7 月西藏一侧冰面湖溃决成洪;2026 年 8 月 26 日,尼泊尔境内东林藏布上游海拔约 5200 米处冰崩,演变为泥石流,7 分钟奔流 20 公里抵达吉隆口岸,再向下游冲入尼泊尔近 100 公里。Allen 等(2019)将吉隆县六个冰湖列入青藏高原最危险的三十个冰湖,其下游暴露区均在尼泊尔。
·
The August 2026 debris flow devastated roughly 100 km of the Lhende–Bhote Koshi–Trishuli corridor, raising the Trishuli about 9 m at Galchhi (ICIMOD). The July 2025 supraglacial outburst ran 35 km from its source lake on the Purepu Glacier down to the Rasuwagadhi border post (HiRISK 2025) — a reach upstream of this marker, so it is not drawn. The drawn line follows the Lende Khola, Bhote Koshi and Trishuli for that 100 km, passing Galchhi about 15 km before its end. · 2026 年 8 月的泥石流重创东林藏布—波特科西—特里苏利河道约 100 公里,使加尔奇处特里苏利河水位抬升约 9 米(ICIMOD)。2025 年 7 月的冰面湖溃决自 Purepu 冰川源湖至热索瓦口岸长 35 公里(HiRISK 2025)——该段位于本标记上游,因此未在图上绘出。图上的线沿东林藏布、波特科西与特里苏利河绘出这 100 公里,在终点前约 15 公里处经过加尔奇。
Along the Lende Khola, about 100 km · 沿东林藏布约 100 公里
August 2026 ice-collapse debris flow · 2026 年 8 月冰崩泥石流: 100 km (ICIMOD (2026). Kyirong–Rasuwa flood 2026, Nepal–China border (situation page). · ICIMOD (2026). Major flash flood sweeps through Nepal's Rasuwa district, raising… · 中国地质调查局 (2026). 7分钟20公里!冰崩碎屑流形成泥石流高速冲击吉隆口岸 — expert account by the Ministry of N…)
-
Imja Tsho 伊姆贾错 Glacial lake outburst flood · 冰湖溃决
Khumbu, Solukhumbu, Nepal · 尼泊尔索卢昆布县昆布地区
Grew from about 0.03 km² in 1962 to 75 × 10⁶ m³ by 2014, directly above the Everest Base Camp trekking corridor; lowered 3.4 m in 2016 by a Nepal Army and UNDP project. Modelling rates near-term breach hazard low to moderate — the concern is exposure, and an early-warning system reported unmaintained since 2016.
从 1962 年的约 0.03 平方公里扩张到 2014 年的 7500 万立方米,正对珠峰大本营徒步走廊;2016 年由尼泊尔军方与 UNDP 项目人工降低水位 3.4 米。模拟评估近期溃决危险为低至中等——真正的问题在于暴露度,以及据报自 2016 年起再无维护的预警系统。
·
Modelled floods reach Dingboche about 8 km down the Imja Khola and Phakding about 33 km below the lake; the modelled river runs 38.5 km from the outlet (Somos-Valenzuela et al. 2015). · 模拟洪水沿伊姆贾河下行约 8 公里抵达丁波切、湖下约 33 公里抵达帕克丁;模拟河段自湖口起长 38.5 公里(Somos-Valenzuela 等 2015)。
Along the Imja Khola, about 8 km, to Dingboche · 沿伊姆贾河约 8 公里,至丁波切
Along the Imja Khola, about 33 km, to Phakding · 沿伊姆贾河约 33 公里,至帕克丁
No lowering (current lake) · 未降低(现状湖面): 7,544 m³/s (Somos-Valenzuela, M. A., McKinney, D. C., Byers, A. C., Rounce, D. R., Portocarr…)
Lake lowered 3 m · 湖面降低 3 米: 7,053 m³/s (Somos-Valenzuela, M. A., McKinney, D. C., Byers, A. C., Rounce, D. R., Portocarr…)
Lake lowered 10 m · 湖面降低 10 米: 4,479 m³/s (Somos-Valenzuela, M. A., McKinney, D. C., Byers, A. C., Rounce, D. R., Portocarr…)
Lake lowered 20 m · 湖面降低 20 米: 1,975 m³/s (Somos-Valenzuela, M. A., McKinney, D. C., Byers, A. C., Rounce, D. R., Portocarr…)
-
Lake Palcacocha 帕尔卡科查湖 Glacial lake outburst flood · 冰湖溃决
Cojup valley above Huaraz, Cordillera Blanca, Áncash, Peru · 秘鲁安卡什大区瓦拉斯上游科胡普谷
Source of the December 1941 flood that destroyed part of Huaraz, killing an estimated 1,800–4,000 people. The lake regrew roughly 34-fold between 1972 and 2016 and is held down by ten siphons; it is among 152 lakes flagged in INAIGEM's national risk assessment and is Peru's most intensively monitored.
1941 年 12 月冲毁瓦拉斯部分城区的冰湖洪水即发源于此,估计 1800–4000 人遇难。1972–2016 年湖体扩大约 34 倍,现由十套虹吸系统压低水位;被列入 INAIGEM 全国评估标记的 152 个风险冰湖,是秘鲁监测最密集的一处。
·
The 1941 flood ran about 23 km down the Cojup valley into Huaraz (Mergili et al. 2020). · 1941 年洪水沿科胡普谷奔流约 23 公里冲入瓦拉斯(Mergili 等 2020)。
Along the Quebrada Cojup, about 23 km, to Huaraz · 沿科胡普谷约 23 公里,至瓦拉斯
Small avalanche · 小型冰崩情景: 500,000 m³ (Somos-Valenzuela, M. A., Chisolm, R. E., Rivas, D. S., Portocarrero, C., & McKin…)
Medium avalanche · 中型冰崩情景: 1 × 10⁶ m³ (Somos-Valenzuela, M. A., Chisolm, R. E., Rivas, D. S., Portocarrero, C., & McKin…)
Large avalanche · 大型冰崩情景: 3 × 10⁶ m³ · 63,400 m³/s (Somos-Valenzuela, M. A., Chisolm, R. E., Rivas, D. S., Portocarrero, C., & McKin…)
1941 flood · 1941 年洪水: 13 × 10⁶ m³ · 23 km (Mergili, M., Pudasaini, S. P., Emmer, A., Fischer, J.-T., Cochachin, A., & Frey,…)
-
Petra Pervogo Range 彼得一世山脉 Glacier detachment · 冰岩崩塌
Between the Surkhob and Obikhingou rivers, central Tajikistan · 塔吉克斯坦中部苏尔霍布河与奥比欣戈乌河之间
Thirteen detachments and ice or rock-ice avalanches clustered in just four catchments between 1973 and 2019, including five detachments of entire valley glaciers — with almost no ground observation. Most occurred in July–September of warmer-than-trend years.
1973–2019 年间仅四条流域就集中发生 13 次冰川滑脱与冰崩/冰岩崩,其中五次为整条山谷冰川滑脱——几乎没有任何地面观测。多数发生在偏暖年份的 7–9 月。
·
Documented runout distances of 2–19 km in the 1973–2019 events (Leinss et al. 2021). This is a regional entry: the line follows the valley below the marker, while the 19.1 km runout it is drawn to was measured in the Shuraki Kapali catchment about 14 km west. · 1973–2019 年事件的堆积距离为 2–19 公里(Leinss 等 2021)。这是一个区域性条目:图上的线沿标记下方的山谷绘出,而所依据的 19.1 公里堆积距离测自西侧约 14 公里的舒拉基卡帕利流域。
About 19.1 km down-slope · 沿坡向下约 19.1 公里
2003 glacier detachment · 2003 年冰川滑脱: 2.9 × 10⁶ m³ · 7.3 km (Leinss, S., Bernardini, E., Jacquemart, M., & Dokukin, M. (2021). Glacier detach…)
2016 rock-ice avalanche · 2016 年冰岩崩: 19.1 km (Leinss, S., Bernardini, E., Jacquemart, M., & Dokukin, M. (2021). Glacier detach…)
2017 glacier detachment · 2017 年冰川滑脱: 8.8 × 10⁶ m³ · 8.5 km (Leinss, S., Bernardini, E., Jacquemart, M., & Dokukin, M. (2021). Glacier detach…)
2019 glacier detachment · 2019 年冰川滑脱: 8.6 × 10⁶ m³ (Leinss, S., Bernardini, E., Jacquemart, M., & Dokukin, M. (2021). Glacier detach…)
-
Planpincieux Glacier 普朗潘修冰川 Glacier detachment · 冰岩崩塌
Grandes Jorasses, Val Ferret, Courmayeur, Italy · 意大利库马耶费雷谷大若拉斯峰南麓
A temperate hanging glacier above an inhabited valley road, monitored since 2013. Break-off scenarios around 500,000 m³ forced precautionary road closures and evacuations in 2019 and 2020, and the glacier accelerated again in mid-2026.
悬于有人居住谷地道路上方的温性悬冰川,自 2013 年起持续监测。约 50 万立方米的崩落情景曾在 2019 与 2020 年触发预防性封路和撤离,2026 年年中冰川再度加速。
·
Modelled ice-avalanche scenarios reach the Val Ferret access road and parts of Planpincieux hamlet (SLF expert report 2013), about 3 km below the glacier. · 模拟冰崩情景可抵达费雷谷公路与普朗潘修村部分区域(SLF 专家报告 2013);该处位于冰川下方约 3 公里。
About 3 km down-slope, to Planpincieux · 沿坡向下约 3 公里,至普朗潘修
Summer scenario S1 · 夏季情景 S1: 20,000 m³ (Margreth, S. (2013). Hazard caused by ice avalanches from the Planpincieux Glaci…)
Summer scenario S2 · 夏季情景 S2: 200,000 m³ (Margreth, S. (2013). Hazard caused by ice avalanches from the Planpincieux Glaci…)
Summer scenario S3 · 夏季情景 S3: 1 × 10⁶ m³ (Margreth, S. (2013). Hazard caused by ice avalanches from the Planpincieux Glaci…)
-
Sedongpu basin 色东普沟 Glacier detachment · 冰岩崩塌
Yarlung Tsangpo gorge, below Gyala Peri, Tibet, China · 中国西藏雅鲁藏布大峡谷加拉白垒峰下
The most active detachment site known. The October 2018 detachment (about 130 × 10⁶ m³) and the erosion that followed have exported more than 600 × 10⁶ m³ from the basin since about 2017, repeatedly damming the Yarlung Tsangpo — for days in 2018, and again in 2021 and 2023.
已知最活跃的冰川滑脱区。2018 年 10 月的整体滑脱(约 1.3 亿立方米)及其后的侵蚀,自 2017 年前后已从沟内输出逾 6 亿立方米物质,多次堵塞雅鲁藏布江——2018 年断流数日,2021、2023 年再度壅塞。
·
Detachments and rock–ice avalanches run the 4 km from the glacier tongue down to the Yarlung Tsangpo; the 2018 detachment dammed the river for about 60 hours and raised it about 75 m (Kääb & Girod 2023; Yang et al. 2023). · 冰川脱离与冰岩崩塌自冰舌下行 4 公里直抵雅鲁藏布江;2018 年脱离体壅塞干流约 60 小时,河面抬升约 75 米(Kääb 与 Girod 2023;Yang 等 2023)。
About 4 km down-slope · 沿坡向下约 4 公里
2017 rock–ice avalanches · 2017 年冰岩崩塌: 50 × 10⁶ m³ (Kääb, A., & Girod, L. (2023). Brief communication: Rapid ~335 × 10⁶ m³ bed erosi… · Kääb, A., Jacquemart, M., Gilbert, A., Leinss, S., Girod, L., Huggel, C., Falasc… · Yang, W., Wang, Z., An, B., Chen, Y., Zhao, C., Li, C., Wang, Y., & Wang, W. (20…)
2018 glacier detachment · 2018 年冰川脱离: 130 × 10⁶ m³ · 32,000 m³/s (Kääb, A., & Girod, L. (2023). Brief communication: Rapid ~335 × 10⁶ m³ bed erosi… · Kääb, A., Jacquemart, M., Gilbert, A., Leinss, S., Girod, L., Huggel, C., Falasc… · Yang, W., Wang, Z., An, B., Chen, Y., Zhao, C., Li, C., Wang, Y., & Wang, W. (20…)
March 2021 collapse · 2021 年 3 月崩塌: 50 × 10⁶ m³ (Yang, W., Wang, Z., An, B., Chen, Y., Zhao, C., Li, C., Wang, Y., & Wang, W. (20… · Kääb, A., & Girod, L. (2023). Brief communication: Rapid ~335 × 10⁶ m³ bed erosi…)
-
Spitze Stei 施皮策施泰因不稳定岩体 Glacier detachment · 冰岩崩塌
Above Oeschinensee, Kandersteg, Bern, Switzerland · 瑞士伯尔尼州坎德施泰格厄希嫩湖上方
About 20 × 10⁶ m³ of unstable rock — roughly twice the volume of the 2025 Blatten collapse — moving locally more than 10 cm a day in summer, with permafrost degradation implicated. Current assessments expect piecemeal failure rather than a single collapse.
约 2000 万立方米不稳定岩体——约为 2025 年 Blatten 崩塌体量的两倍——夏季局部日位移超过 10 厘米,多年冻土退化被认为是成因之一。当前评估预期为分批崩落而非一次性整体崩塌。
·
Debris-flow scenarios reach Kandersteg village about 5 km below; the August 2026 rockfall already sent flows into the Oeschibach. · 泥石流情景可达下方约 5 公里的坎德施泰格村;2026 年 8 月的岩崩已将碎屑送入 Oeschibach 河道。
Along the Öschibach, about 5 km, to Kandersteg · 沿厄希溪约 5 公里,至坎德施泰格
Several large rockfalls (S2) · 多次大型岩崩(S2): 1 × 10⁶ m³ (NDR Consulting GmbH & Hunziker Gefahrenmanagement (2022). Spitze Stei — Sekundär…)
Multiple large falls (S3) · 多次大规模崩塌(S3): 3 × 10⁶ m³ (NDR Consulting GmbH & Hunziker Gefahrenmanagement (2022). Spitze Stei — Sekundär…)
Large rock avalanche (S5) · 大型山体崩塌(S5): 8 × 10⁶ m³ (NDR Consulting GmbH & Hunziker Gefahrenmanagement (2022). Spitze Stei — Sekundär…)
Total collapse (S6) · 整体崩塌(S6): 20 × 10⁶ m³ (NDR Consulting GmbH & Hunziker Gefahrenmanagement (2022). Spitze Stei — Sekundär…)
-
Teskey Range short-lived lakes 捷斯凯山脉短命冰川湖群 Glacial lake outburst flood · 冰湖溃决
South of Lake Issyk-Kul, Kyrgyzstan (regional entry) · 吉尔吉斯斯坦伊塞克湖以南(区域条目)
'Tunnel-type' lakes here fill and drain through ice tunnels within months, evading routine inventories: 160 such lakes were mapped 2013–2018. The 2008 western Zyndan outburst (437,000 m³) killed three; Zyndan burst again in August 2024. A regional entry — the individual lakes do not persist long enough to pin.
此地的“隧道型”冰川湖经冰内隧道在数月内充水又排空,常规编目难以捕捉:2013–2018 年测绘到 160 个。2008 年西津丹湖溃决(43.7 万立方米)致三人遇难;2024 年 8 月津丹湖再度溃决。区域性条目——单个湖泊存续太短,无法定点。
·
The 2008 western Zyndan flood damaged villages up to about 15 km downstream (Narama et al. 2010). OpenStreetMap maps no channel for the Zyndan itself, so the line runs straight from the lake to the Tong river and then down it; at 15 km it is still short of Tuura-Suu village. · 2008 年西津丹湖溃决洪水波及下游约 15 公里内的村庄(Narama 等 2010)。OpenStreetMap 未收录津丹河本身的河道,图上的线自湖泊直连通河后再沿其下行;行至 15 公里处尚未抵达图拉苏村。
Along the Tong River, about 15 km · 沿通河约 15 公里
2014 Karateke drainage · 2014 年卡拉捷凯湖排水: 123,000 m³ (Narama, C., Daiyrov, M., Duishonakunov, M., Tadono, T., Sato, H., Kääb, A., Ukit…)
2013 Jeruy drainage · 2013 年杰鲁伊湖排水: 182,000 m³ (Narama, C., Daiyrov, M., Duishonakunov, M., Tadono, T., Sato, H., Kääb, A., Ukit…)
2006 Kashkasuu drainage · 2006 年卡什卡苏湖排水: 194,000 m³ (Narama, C., Daiyrov, M., Duishonakunov, M., Tadono, T., Sato, H., Kääb, A., Ukit…)
2008 western Zyndan flood · 2008 年西津丹湖洪水: 437,000 m³ · 15 km (Narama, C., Duishonakunov, M., Kääb, A., Daiyrov, M., & Abdrakhmatov, K. (2010).… · Narama, C., Daiyrov, M., Duishonakunov, M., Tadono, T., Sato, H., Kääb, A., Ukit…)
-
Thorthormi Tsho 托托米措 Glacial lake outburst flood · 冰湖溃决
Lunana, Gasa District, Bhutan · 不丹加萨宗卢纳纳
Ranked most outburst-susceptible of Bhutan's 17 potentially dangerous glacial lakes, separated from Raphstreng Tsho below by a narrow sliding moraine. Lowered 5 m by manual excavation in 2008–2012; a subsidiary lake breached in June 2019, an avalanche-triggered wave overtopped it in October 2023, and a siphon pilot began in 2025.
在不丹 17 个潜在危险冰湖中被列为最易溃决的一个,与下方的拉普斯特仑措仅隔一道滑动中的窄冰碛垄。2008–2012 年人工开挖降低水位 5 米;2019 年 6 月一处副湖溃口,2023 年 10 月冰崩涌浪漫顶,2025 年起试点虹吸排水。
·
Outburst scenarios follow the Pho Chhu about 90 km to Punakha — the reach of the existing early-warning corridor; the modelled maximum breach peaks at 14 128 m³/s there (NCHM; Wangchuk & Tsubaki 2024). · 溃决情景沿波曲河下行约 90 公里至普那卡——即现有预警走廊的覆盖范围;最大溃口情景在该处峰值流量 14 128 立方米每秒(NCHM;Wangchuk 与 Tsubaki 2024)。
Along the Pho Chhu, about 90 km, to Punakha · 沿波曲河约 90 公里,至普那卡
Maximum breach · 最大溃口: 283 × 10⁶ m³ · 16,360 m³/s (Wangchuk, T., & Tsubaki, R. (2024). A glacial lake outburst flood risk assessmen…)
Half breach depth · 半深溃口: 9,700 m³/s (Wangchuk, T., & Tsubaki, R. (2024). A glacial lake outburst flood risk assessmen…)
Chart 1 of 3
The record grows
Every recorded event since 1900, one row per mechanism, one bar per year. The three rows are on different scales: outburst floods are counted in the hundreds, detachments and displacement waves in the tens. · 1900 年以来每一次有记录的事件:每种机制一行,每年一根柱。三行的刻度不同:冰湖溃决以百计,冰岩崩塌与涌浪以十计。
Chart 2 of 3
Watching changes the record
Events per year since 1900, coloured by mechanism. Bashkova et al. report step increases in recorded events in the mid-1960s and the early 2010s — the arrivals of satellite imagery and of routine high-resolution monitoring — and a Northern Hemisphere summer peak consistent with meltwater input. Both patterns are drawn here from the data itself. The step changes are the reporting-bias problem made visible: the record grows partly because failures increase, and partly because watching does. · 1900 年以来的逐年事件数,按机制着色。Bashkova 等人报告记录事件数在 1960 年代中期与 2010 年代初出现两次阶跃——分别对应卫星影像与高分辨率常态化监测的到来——以及与融水输入一致的北半球夏季峰值。这两种模式都直接由数据绘出。阶跃正是报告偏差问题的可视化:记录的增长,一部分来自失稳事件增多,一部分来自观测本身增多。
Chart 3 of 3
A summer signal
The same events by month of the year, north and south of the equator. The Northern Hemisphere peaks in its summer, when meltwater is most abundant; the southern record is too thin to show a season. · 同一批事件按月份统计,分赤道以北和以南。北半球在其夏季达到峰值,此时融水最为充沛;南半球记录太少,看不出季节。
How this map is made
Step 1 of 6
Start from published lists
Scientists keep three open lists of past events, one per mechanism. We read them as they are: no model, no probability. · 科学家维护着三份公开的历史事件目录,每种机制一份。我们照原样读取:不建模型,不算概率。
Example: the July 2016 Aru collapse in Tibet is one row in the glacier failure list, with a date, a place and 68 million cubic metres of ice. That row becomes one dot. · 例:2016 年 7 月西藏阿汝冰崩在冰川失稳目录中是一行记录,有日期、地点和 6800 万立方米的冰。这一行就成为图上的一个点。
Step 2 of 6
Merge into one record
One entry per event, duplicates removed. Where the lists disagree, both events stay, tagged by what moved first. · 每次事件一条记录,去掉重复。目录之间有分歧时,两次事件都保留,按先动的是什么加以标注。
Example: the 2013 Chorabari flood in India is in both flood lists, so it becomes one dot. Chamoli 2021 is left out of the glacier list because rock fell before ice. It is here, tagged “rock first”. · 例:2013 年印度乔拉巴里冰湖溃决两份洪水目录都收录,于是合并为一个点。2021 年查莫利事件因岩体先于冰体崩落而未被冰川失稳目录收录;本图收录,并标注为“岩体先失稳”。
Step 3 of 6
Add what no list holds
Waves set off by ice or rock falling into water have had no global list since 2012. Each is entered here from its own paper. · 冰体或岩体坠入水中激起的巨浪,2012 年之后再无全球目录。每一次都在这里按各自的论文录入。
Example: in 1958 a wave in Lituya Bay, Alaska, climbed 524 m up the shore. The paper that measured it is the source for that dot. · 例:1958 年阿拉斯加利图亚湾的巨浪冲上岸边 524 米高处。测得这个数字的那篇论文,就是这个点的来源。
Step 4 of 6
List watched sites
A place that has not failed is shown only if an institution monitors it or a study has assessed it. Watched is not ranked. · 尚未失稳的地点,只有在有机构监测或有研究评估过时才会显示。受监测不等于排名。
Example: Barry Arm in Alaska is on the map because US agencies watch it with radar and seismometers. That makes it the best measured, not the most dangerous. · 例:阿拉斯加的巴里湾坡体在图上,是因为美国的机构用雷达和地震仪监测它。这说明它测得最细,不说明它最危险。
Step 5 of 6
Draw reach from the sources
A line follows the valley or fjord the sources name, for the distance they give. Nothing is computed. · 线沿来源所述的山谷或峡湾延伸,长度就是来源给出的距离。不做任何计算。
Example: a study says a flood from Lake Palcacocha would run 23 km down the Cojup valley to the city of Huaraz, Peru. So the line runs down that valley, 23 km, and stops at Huaraz. · 例:研究指出帕尔卡科查湖一旦溃决,洪水将沿科胡普谷奔流 23 公里,抵达秘鲁瓦拉斯市。于是这条线沿那条山谷画 23 公里,止于瓦拉斯。
Step 6 of 6
Check every entry
Each cites a paper or an official page, and scripts check before merging. Blank areas are unobserved, not safe. · 每条记录都引用一篇论文或一个官方页面,合并前由脚本检查。空白区域是未被观测,不是安全。
Example: a new site backed only by a news article is refused. Iceland and Switzerland show almost a thousand dots because records are kept there. An empty valley in the Andes is not necessarily quiet. · 例:只以一则新闻为来源的新地点会被拒绝。冰岛和瑞士有近千个点,是因为那里有人记录。安第斯山脉里一条空白的山谷,未必平静。
Sources, and how to add to this map
Upstream databases
-
Global database of glacier failures (1900–2025)
- Rows ingested · 摄入行数
- 474
- Version · 版本
- v1.0-subm
- Licence · 许可
- CC-BY-4.0
- Accessed · 访问日期
- 2026-09-01
preprint in open review at ESSD (essd-2026-481)
-
Global database of historic glacier lake outburst floods
- Rows ingested · 摄入行数
- 2,406
- Version · 版本
- V3.1
- Licence · 许可
- CC-BY-4.0
- Accessed · 访问日期
- 2026-09-01
published (ESSD 15, 2983–3000, 2023); the live web map is at V4.2, not archived on Zenodo — this ingest pins the citable V3.1
-
HMAGLOFDB — GLOFs in High Mountain Asia
- Rows ingested · 摄入行数
- 610
- Version · 版本
- main branch, commit of 2026-08-13 (release v1.3.0 = 10.5281/zenodo.18257243)
- Licence · 许可
- CC0-1.0
- Accessed · 访问日期
- 2026-09-01
published (ESSD 15, 3941–3961, 2023); version-controlled on GitHub
Basemap and terrain
Streets, rivers and place names come from OpenFreeMap vector tiles (OpenMapTiles schema, OpenStreetMap data, ODbL). Relief and the terrain tint come from the AWS Terrain Tiles (Terrarium encoding; Mapzen/Tilezen, compiled from SRTM, GMTED2010, ETOPO1 and other public elevation sources); land below sea level is filled from Natural Earth, which ships with the page. When the globe loads, tiles are requested from those two services; nothing else is contacted, and no analytics run.
- OpenFreeMap · OpenMapTiles · © OpenStreetMap contributors (ODbL)
- Mapzen / AWS Terrain Tiles (Terrarium) — SRTM, GMTED2010, ETOPO1 and the national sources listed in that attribution document
- Natural Earth land polygons (public domain), vendored
- MapLibre GL JS 6.6.0 (BSD-3-Clause), vendored
Reach lines
Each reach line follows the valley or fjord a watched site's sources name, traced along OpenStreetMap waterways at development time by scripts/trace_paths.py to the documented distance and place; the fjord routes are hand-placed along the water. The traced geometry ships with the page as data/paths.json, a derivative of OpenStreetMap data (© OpenStreetMap contributors, ODbL 1.0).
Bibliography 79
- Alaska Division of Geological & Geophysical Surveys. Barry Arm landslide — monitoring and hazard information (status page, updated 7 Aug 2026). agency
- Allen, S. K., Zhang, G., Wang, W., Yao, T., & Bolch, T. (2019). Potentially dangerous glacial lakes across the Tibetan Plateau revealed using a large-scale automated assessment approach. Science Bulletin, 64(7), 435–445. https://doi.org/10.1016/j.scib.2019.03.011
- Barnhart, K. R., Jones, R. P., George, D. L., Coe, J. A., & Staley, D. M. (2021). Preliminary assessment of the wave generating potential from landslides at Barry Arm, Prince William Sound, Alaska. U.S. Geological Survey Open-File Report 2021–1071, 28 p. https://doi.org/10.3133/ofr20211071 report
- Bashkova, E., Rupper, S. B., Shugar, D. H., & Forster, R. R. (2026). Global database of glacier failures (1900–2025). Earth System Science Data Discussions [preprint, in review]. https://doi.org/10.5194/essd-2026-481 preprint
- Björnsson, H. (2003). Subglacial lakes and jökulhlaups in Iceland. Global and Planetary Change, 35(3–4), 255–271. https://doi.org/10.1016/S0921-8181(02)00130-3
- Björnsson, H. (2010). Understanding jökulhlaups: from tale to theory. Journal of Glaciology, 56(200), 1002–1010. https://doi.org/10.3189/002214311796406086
- Büntgen, U., Oppenheimer, C., Farinotti, D., Nahtz, T., & Esper, J. (2025). The 2025 Blatten disaster in the Swiss Alps followed exceptional warming and highlights the vulnerability of people and heritage in glaciated landscapes. Communications Earth & Environment, 6, 994. https://doi.org/10.1038/s43247-025-02994-8
- Carrillo-Ponce, A., Heimann, S., Petersen, G. M., Walter, T. R., Cesca, S., & Dahm, T. (2024). The 16 September 2023 Greenland Megatsunami: Analysis and Modeling of the Source and a Week-Long, Monochromatic Seismic Signal. The Seismic Record, 4(3), 172–183. https://doi.org/10.1785/0320240013
- Chen, M., Chen, Y., Fang, G., Zheng, G., Li, Z., Li, Y., & Zhu, Z. (2024). Risk assessment of glacial lake outburst flood in the Central Asian Tienshan Mountains. npj Climate and Atmospheric Science, 7, 209. https://doi.org/10.1038/s41612-024-00755-6
- Dahl-Jensen, T., Larsen, L. M., Pedersen, S. A. S., Pedersen, J., Jepsen, H. F., Pedersen, G., Nielsen, T., Pedersen, A. K., von Platen-Hallermund, F., & Weng, W. (2004). Landslide and Tsunami 21 November 2000 in Paatuut, West Greenland. Natural Hazards, 31, 277–287. https://doi.org/10.1023/B:NHAZ.0000020264.70048.95
- Dai, C., Higman, B., Lynett, P. J., Jacquemart, M., Howat, I. M., Liljedahl, A. K., Dufresne, A., Freymueller, J. T., Geertsema, M., Ward Jones, M., & Haeussler, P. J. (2020). Detection and Assessment of a Large and Potentially Tsunamigenic Periglacial Landslide in Barry Arm, Alaska. Geophysical Research Letters, 47(22), e2020GL089800. https://doi.org/10.1029/2020GL089800
- Daiyrov, M., & Narama, C. (2021). Formation, evolution, and drainage of short-lived glacial lakes in permafrost environments of the northern Teskey Range, Central Asia. Natural Hazards and Earth System Sciences, 21, 2245–2256. https://doi.org/10.5194/nhess-21-2245-2021
- Evans, S. G., Bishop, N. F., Fidel Smoll, L., Valderrama Murillo, P., Delaney, K. B., & Oliver-Smith, A. (2009). A re-examination of the mechanism and human impact of catastrophic mass flows originating on Nevado Huascarán, Cordillera Blanca, Peru in 1962 and 1970. Engineering Geology, 108(1–2), 96–118. https://doi.org/10.1016/j.enggeo.2009.06.020
- Fondazione Montagna sicura. Informazioni ghiacciaio di Planpincieux (official monitoring information page). agency
- GAPHAZ (2017). Assessment of Glacier and Permafrost Hazards in Mountain Regions — Technical Guidance Document. Prepared by Allen, S., Frey, H., Huggel, C., et al. IACS/IPA Standing Group on Glacier and Permafrost Hazards in Mountains. Zurich/Lima, 72 pp. report
- Gauthier, D., Anderson, S. A., Fritz, H. M., & Giachetti, T. (2018). Karrat Fjord (Greenland) tsunamigenic landslide of 17 June 2017: initial 3D observations. Landslides, 15, 327–332. https://doi.org/10.1007/s10346-017-0926-4
- Gemeinde Kandersteg (2026). Rutschung Spitze Stei — Informationen, Überwachung, Lagebeurteilung. agency
- GEOTEST AG. Gefahrenmanagement «Spitze Stei» (reference page): comprehensive investigation and continuous monitoring since 2018 on behalf of the Kandersteg commune. report
- Gilbert, A., Leinss, S., Kargel, J., Kääb, A., Gascoin, S., Leonard, G., Berthier, E., Karki, A., & Yao, T. (2018). Mechanisms leading to the 2016 giant twin glacier collapses, Aru Range, Tibet. The Cryosphere, 12(9), 2883–2900. https://doi.org/10.5194/tc-12-2883-2018
- Giordan, D., Dematteis, N., Allasia, P., & Motta, E. (2020). Classification and kinematics of the Planpincieux Glacier break-offs using photographic time-lapse analysis. Journal of Glaciology, 66(256), 188–202. https://doi.org/10.1017/jog.2019.99
- Harbitz, C. B., Glimsdal, S., Løvholt, F., Kveldsvik, V., Pedersen, G. K., & Jensen, A. (2014). Rockslide tsunamis in complex fjords: From an unstable rock slope at Åkerneset to tsunami risk in western Norway. Coastal Engineering, 88, 101–122. https://doi.org/10.1016/j.coastaleng.2014.02.003
- Harrison, S., Kargel, J. S., Huggel, C., Reynolds, J., Shugar, D. H., Betts, R. A., Emmer, A., Glasser, N., Haritashya, U. K., Klimeš, J., Reinhardt, L., Schaub, Y., Wiltshire, A., Regmi, D., & Vilímek, V. (2018). Climate change and the global pattern of moraine-dammed glacial lake outburst floods. The Cryosphere, 12(4), 1195–1209. https://doi.org/10.5194/tc-12-1195-2018
- Higman, B., Shugar, D. H., Stark, C. P., et al. (32 authors) (2018). The 2015 landslide and tsunami in Taan Fiord, Alaska. Scientific Reports, 8, 12993. https://doi.org/10.1038/s41598-018-30475-w
- Huggel, C., Zgraggen-Oswald, S., Haeberli, W., Kääb, A., Polkvoj, A., Galushkin, I., & Evans, S. G. (2005). The 2002 rock/ice avalanche at Kolka/Karmadon, Russian Caucasus: assessment of extraordinary avalanche formation and mobility, and application of QuickBird satellite imagery. Natural Hazards and Earth System Sciences, 5(2), 173–187. https://doi.org/10.5194/nhess-5-173-2005
- Icelandic Meteorological Office (2024). Conclusion of Grímsvötn glacial outburst flood (news, 23 January 2024). agency
- Icelandic Meteorological Office. Volcanoes — monitoring, status and jökulhlaup bulletins. agency
- ICIMOD (2026). Kyirong–Rasuwa flood 2026, Nepal–China border (situation page). agency
- ICIMOD (2026). Major flash flood sweeps through Nepal's Rasuwa district, raising fears of further downstream flooding (press release, updated 27 August 2026). agency
- INAIGEM (2024). Evaluación nacional de lagunas glaciares con riesgo de desborde 2024. Instituto Nacional de Investigación en Glaciares y Ecosistemas de Montaña, Huaraz, Perú. https://hdl.handle.net/20.500.12748/608 report
- Islam, N., Carrivick, J. L., Coulthard, T., Westoby, M., Dunning, S., & Gindraux, S. (2025). A growing threat of multi-hazard cascades highlighted by the Birch Glacier collapse and Blatten landslide in the Swiss Alps. Geology Today, 41(5), 200–205. https://doi.org/10.1111/gto.12526
- Jacquemart, M., Loso, M., Leopold, M., Welty, E., Berthier, E., Hansen, J. S., Sykes, J., & Tiampo, K. (2020). What drives large-scale glacier detachments? Insights from Flat Creek glacier, St. Elias Mountains, Alaska. Geology, 48(7), 703–707. https://doi.org/10.1130/G47211.1
- Kc, D., Khatri, T., & Sharma, R. (2021). Glacial Lake Outburst Floods Early Warning System to save lives and livelihood of the Nepal Himalaya communities: A case study of Imja Glacial Lake, Nepal. EGU General Assembly 2021, EGU21-4163. https://doi.org/10.5194/egusphere-egu21-4163 report
- Kenner, R., Gischig, V., Gojcic, Z., Quéau, Y., Kienholz, C., Figi, D., Thöny, R., & Bonanomi, Y. (2022). The potential of point clouds for the analysis of rock kinematics in large slope instabilities: examples from the Swiss Alps: Brienz/Brinzauls, Pizzo Cengalo and Spitze Stei. Landslides, 19, 1357–1377. https://doi.org/10.1007/s10346-022-01852-4
- Kristensen, L., Indrevær, K., Pless, G., Hermanns, R., & Nicolet, P. S. (2026). Fjellskred fra Åknes — Reviderte scenarioer, sannsynligheter og konsekvenser. NVE Rapport nr. 16/2026. Norges vassdrags- og energidirektorat, Oslo. report
- Kääb, A., & Girod, L. (2023). Brief communication: Rapid ~335 × 10⁶ m³ bed erosion after detachment of the Sedongpu Glacier (Tibet). The Cryosphere, 17(6), 2533–2541. https://doi.org/10.5194/tc-17-2533-2023
- Kääb, A., Aga, J., Treichler, D., Girod, L., & Chao, W. (2026). Recent giant detachment of a glacier on the Tibetan plateau provoked by its frozen tongue. Communications Earth & Environment, 7, 74. https://doi.org/10.1038/s43247-025-03125-z
- Kääb, A., Jacquemart, M., Gilbert, A., Leinss, S., Girod, L., Huggel, C., Falaschi, D., Ugalde, F., Petrakov, D., Chernomorets, S., Dokukin, M., Paul, F., Gascoin, S., Berthier, E., & Kargel, J. S. (2021). Sudden large-volume detachments of low-angle mountain glaciers — more frequent than thought? The Cryosphere, 15(4), 1751–1785. https://doi.org/10.5194/tc-15-1751-2021
- Kääb, A., Leinss, S., Gilbert, A., Bühler, Y., Gascoin, S., Evans, S. G., Bartelt, P., Berthier, E., Brun, F., Chao, W., Farinotti, D., Gimbert, F., Guo, W., Huggel, C., Kargel, J. S., Leonard, G. J., Tian, L., Treichler, D., & Yao, T. (2018). Massive collapse of two glaciers in western Tibet in 2016 after surge-like instability. Nature Geoscience, 11(2), 114–120. https://doi.org/10.1038/s41561-017-0039-7
- Lala, J. M., Rounce, D. R., & McKinney, D. C. (2018). Modeling the glacial lake outburst flood process chain in the Nepal Himalaya: reassessing Imja Tsho's hazard. Hydrology and Earth System Sciences, 22, 3721–3737. https://doi.org/10.5194/hess-22-3721-2018
- Leinss, S., Bernardini, E., Jacquemart, M., & Dokukin, M. (2021). Glacier detachments and rock-ice avalanches in the Petra Pervogo range, Tajikistan (1973–2019). Natural Hazards and Earth System Sciences, 21, 1409–1429. https://doi.org/10.5194/nhess-21-1409-2021
- Li, X., Kang, S., Nie, Y., Liu, Q., Guo, J., Guo, W., Zheng, M., & Wang, S. (2026). Regionally distinct climatic controls of ice avalanches across the Tibetan Plateau. Advances in Climate Change Research, in press. https://doi.org/10.1016/j.accre.2026.06.026
- Liu, Q., Thapa, A., & Steiner, J. (2025). Rapid Hazard Assessment Report No. CN1: supraglacial lake, Purepu Glacier, Lendhe catchment, Bhote Koshi, 7–8 July 2025. report
- Lynett, P. J., Weiss, R., Higman, B. M., Mattox, A. F., Keen, A. S., Skanavis, V., Tang, H., Ayca, A., & Kalligeris, N. (2025). Tsunami Runup Survey Data From The Taan Fjord Landslide Event. Scientific Data, 12, 1341. https://doi.org/10.1038/s41597-025-05617-1 dataset
- Lützow, N., Veh, G., & Korup, O. (2023). A global database of historic glacier lake outburst floods. Earth System Science Data, 15(7), 2983–3000. https://doi.org/10.5194/essd-15-2983-2023 dataset
- Magnússon, E., Drouin, V., Pálsson, F., Hannesdóttir, K., Belart, J. M. C., Sigurðsson, G., Wuite, J., Jóhannesson, T., Ófeigsson, B. G., Nagler, T., Gudmundsson, M. T., Högnadóttir, T., Parks, M., Roberts, M. J., & Berthier, E. (2022). The jökulhlaup from the subglacial lake Grímsvötn, beneath Vatnajökull ice cap, in November–December 2021, revealing new insight into slowly rising jökulhlaups. EGU General Assembly 2022, EGU22-8240. https://doi.org/10.5194/egusphere-egu22-8240 report
- Margreth, S. (2013). Hazard caused by ice avalanches from the Planpincieux Glacier, Val Ferret, Courmayeur, Italy. SLF Expert Report G2012.27. WSL Institute for Snow and Avalanche Research SLF, Davos, 52 pp. (report to Fondazione Montagna Sicura). report
- Mergili, M., Pudasaini, S. P., Emmer, A., Fischer, J.-T., Cochachin, A., & Frey, H. (2020). Reconstruction of the 1941 GLOF process chain at Lake Palcacocha (Cordillera Blanca, Peru). Hydrology and Earth System Sciences, 24, 93–114. https://doi.org/10.5194/hess-24-93-2020
- Miller, D. J. (1960). Giant Waves in Lituya Bay, Alaska. U.S. Geological Survey Professional Paper 354-C, 51–86. https://doi.org/10.3133/pp354C report
- Ministry of Emergency Situations of the Kyrgyz Republic. Annual monitoring and forecast of hazardous processes and phenomena. agency
- Narama, C., Daiyrov, M., Duishonakunov, M., Tadono, T., Sato, H., Kääb, A., Ukita, J., & Abdrakhmatov, K. (2018). Large drainages from short-lived glacial lakes in the Teskey Range, Tien Shan Mountains, Central Asia. Natural Hazards and Earth System Sciences, 18, 983–995. https://doi.org/10.5194/nhess-18-983-2018
- Narama, C., Duishonakunov, M., Kääb, A., Daiyrov, M., & Abdrakhmatov, K. (2010). The 24 July 2008 outburst flood at the western Zyndan glacier lake and recent regional changes in glacier lakes of the Teskey Ala-Too range, Tien Shan, Kyrgyzstan. Natural Hazards and Earth System Sciences, 10, 647–659. https://doi.org/10.5194/nhess-10-647-2010
- National Center for Hydrology and Meteorology, Royal Government of Bhutan. Reassessment of potentially dangerous glacial lakes (2019) and Thorthormi assessment reports. agency
- NDR Consulting GmbH & Hunziker Gefahrenmanagement (2022). Spitze Stei — Sekundärprozesse: Resultate der Überarbeitung 2021. Report to Schwellenkorporation Kandersteg, 23 February 2022, 83 pp. report
- Norges Geotekniske Institutt (2026). Flodbølger etter skred fra Åknes og Hegguraksla. NVE Ekstern rapport nr. 10/2026. Norges vassdrags- og energidirektorat, Oslo. ISBN 978-82-410-2553-2. report
- Norges vassdrags- og energidirektorat (NVE). Åknes — kontinuerlig overvåket fjellparti (updated 19 Jun 2026; scenario revision NVE report 16/2026). agency
- Paul, F. (2019). Repeat Glacier Collapses and Surges in the Amney Machen Mountain Range, Tibet, Possibly Triggered by a Developing Rock-Slope Instability. Remote Sensing, 11(6), 708. https://doi.org/10.3390/rs11060708
- Petley, D. (2026). The 26 August 2026 catastrophic debris flow in Nepal and Tibet. The Landslide Blog, Eos (AGU), 26 August 2026. report
- Rinzin, S., Zhang, G., Sattar, A., Wangchuk, S., Allen, S. K., Dunning, S., & Peng, M. (2023). GLOF hazard, exposure, vulnerability, and risk assessment of potentially dangerous glacial lakes in the Bhutan Himalaya. Journal of Hydrology, 619, 129311. https://doi.org/10.1016/j.jhydrol.2023.129311
- Roberts, N. J., McKillop, R., Hermanns, R. L., Clague, J. J., & Oppikofer, T. (2014). Preliminary Global Catalogue of Displacement Waves from Subaerial Landslides. In Sassa, K., Canuti, P., & Yin, Y. (Eds.), Landslide Science for a Safer Geoenvironment, Vol. 3, 687–692. Springer, Cham. https://doi.org/10.1007/978-3-319-04996-0_104
- Shrestha, F., Steiner, J. F., Shrestha, R., Dhungel, Y., Joshi, S. P., Inglis, S., Ashraf, A., Wali, S., Walizada, K. M., & Zhang, T. (2023). A comprehensive and version-controlled database of glacial lake outburst floods in High Mountain Asia. Earth System Science Data, 15(9), 3941–3961. https://doi.org/10.5194/essd-15-3941-2023 dataset
- Shugar, D. H., Barnhart, K. R., Berdahl, M., Caplan-Auerbach, J., Ekström, G., Fathian, A., Geertsema, M., Hicks, S. P., Higman, B., Jensen, E. K., Karasözen, E., Lynett, P., Lyons, J., Monahan, T., Roe, G., Svennevig, K., Toney, L., Van Wyk de Vries, M., & West, M. E. (2026). A 481-meter-high landslide-tsunami in a cruise ship–frequented Alaska fjord. Science, 392(6803), eaec3187. https://doi.org/10.1126/science.aec3187
- Shugar, D. H., Jacquemart, M., Shean, D., et al. (53 authors) (2021). A massive rock and ice avalanche caused the 2021 disaster at Chamoli, Indian Himalaya. Science, 373(6552), 300–306. https://doi.org/10.1126/science.abh4455
- Sigurðsson, O., Jónsson, P., Snorrason, Á., Víkingsson, S., Kaldal, I., & Pálsson, S. (2000). The jökulhlaup on Skeiðarársandur in November 1996: Event, discharge and sediment. Second International Conference on Mars Polar Science and Exploration, Abstract 4021. Lunar and Planetary Institute, Houston. report
- Somos-Valenzuela, M. A., Chisolm, R. E., Rivas, D. S., Portocarrero, C., & McKinney, D. C. (2016). Modeling a glacial lake outburst flood process chain: the case of Lake Palcacocha and Huaraz, Peru. Hydrology and Earth System Sciences, 20, 2519–2543. https://doi.org/10.5194/hess-20-2519-2016
- Somos-Valenzuela, M. A., McKinney, D. C., Byers, A. C., Rounce, D. R., Portocarrero, C., & Lamsal, D. (2015). Assessing downstream flood impacts due to a potential GLOF from Imja Tsho in Nepal. Hydrology and Earth System Sciences, 19, 1401–1412. https://doi.org/10.5194/hess-19-1401-2015
- Strzelecki, M. C., & Jaskólski, M. W. (2020). Arctic tsunamis threaten coastal landscapes and communities — survey of Karrat Isfjord 2017 tsunami effects in Nuugaatsiaq, western Greenland. Natural Hazards and Earth System Sciences, 20, 2521–2534. https://doi.org/10.5194/nhess-20-2521-2020
- Svennevig, K., Dahl-Jensen, T., Keiding, M., Merryman Boncori, J. P., Larsen, T. B., Salehi, S., Munck Solgaard, A., & Voss, P. H. (2020). Evolution of events before and after the 17 June 2017 rock avalanche at Karrat Fjord, West Greenland. Earth Surface Dynamics, 8, 1021–1038. https://doi.org/10.5194/esurf-8-1021-2020
- Svennevig, K., Hicks, S. P., Forbriger, T., Lecocq, T., Widmer-Schnidrig, R., Mangeney, A., Hibert, C., Korsgaard, N. J., et al. (2024). A rockslide-generated tsunami in a Greenland fjord rang Earth for 9 days. Science, 385(6714), 1196–1205. https://doi.org/10.1126/science.adm9247
- Taylor, C., Robinson, T. R., Dunning, S., Carr, J. R., & Westoby, M. (2023). Glacial lake outburst floods threaten millions globally. Nature Communications, 14, 487. https://doi.org/10.1038/s41467-023-36033-x
- U.S. Geological Survey, Landslide Hazards Program. Barry Arm, Alaska, landslide and tsunami monitoring. agency
- varsom.no (NVE). Åknes — daily rockslide hazard level. agency
- Walden, J., Jacquemart, M., Higman, B., Hugonnet, R., Manconi, A., & Farinotti, D. (2025). Landslide activation during deglaciation in a fjord-dominated landscape: observations from southern Alaska (1984–2022). Natural Hazards and Earth System Sciences, 25(6), 2045–2073. https://doi.org/10.5194/nhess-25-2045-2025
- Wang, Q., Li, B., Xing, A., Liu, Y., & Zhuang, Y. (2024). A 15-year history of repeated ice-rock avalanches from a single source area in the Qinghai–Tibet Plateau. Landslides, 22, 235–253. https://doi.org/10.1007/s10346-024-02355-0
- Wangchuk, T., & Tsubaki, R. (2024). A glacial lake outburst flood risk assessment for the Phochhu river basin, Bhutan. Natural Hazards and Earth System Sciences, 24, 2523–2540. https://doi.org/10.5194/nhess-24-2523-2024
- WSL Institute for Snow and Avalanche Research SLF. Dynamics of the rock slope instability Spitze Stei (project page). agency
- Yang, W., Wang, Z., An, B., Chen, Y., Zhao, C., Li, C., Wang, Y., & Wang, W. (2023). Early warning system for ice collapses and river blockages in the Sedongpu Valley, southeastern Tibetan Plateau. Natural Hazards and Earth System Sciences, 23, 3015–3029. https://doi.org/10.5194/nhess-23-3015-2023
- Þorsteinsson, Þ. (2010). Jökulhlaup from Grímsvötn subsides. Icelandic Meteorological Office news, 5 November 2010. agency
- 中华人民共和国应急管理部 (2026). 西藏日喀则市吉隆县遭受泥石流灾害 应急管理部持续调度救援处置工作 国家防减救灾委、应急管理部启动国家二级救灾应急响应 (26 August 2026). agency
- 中国地质调查局 (2026). 7分钟20公里!冰崩碎屑流形成泥石流高速冲击吉隆口岸 — expert account by the Ministry of Natural Resources' China Aero Geophysical Survey and Remote Sensing Center, via CCTV (29 August 2026). agency